International Seaways Cyber Watch Dashboard Implementation for a Leading Global Building Products Manufacturer
Location: Philadelphia
Introduction
International Seaways is one of the largest tanker companies worldwide providing energy transportation services for crude oil and petroleum products in International Flag markets. International Seaways owns and operates a fleet of 77 vessels and is committed to the very best operating practices and the highest levels of customer service and operational efficiency.
Problem Statement
The INSW team faced challenges in effectively monitoring and analyzing their cybersecurity posture due to the existence of multiple data sources. The objective is to create a centralized Cyber Watch Dashboard that integrates key cybersecurity data into a single, cohesive, and visually appealing interface. This will facilitate more effective presentation and review of cybersecurity metrics for board members.
List of Data Sources
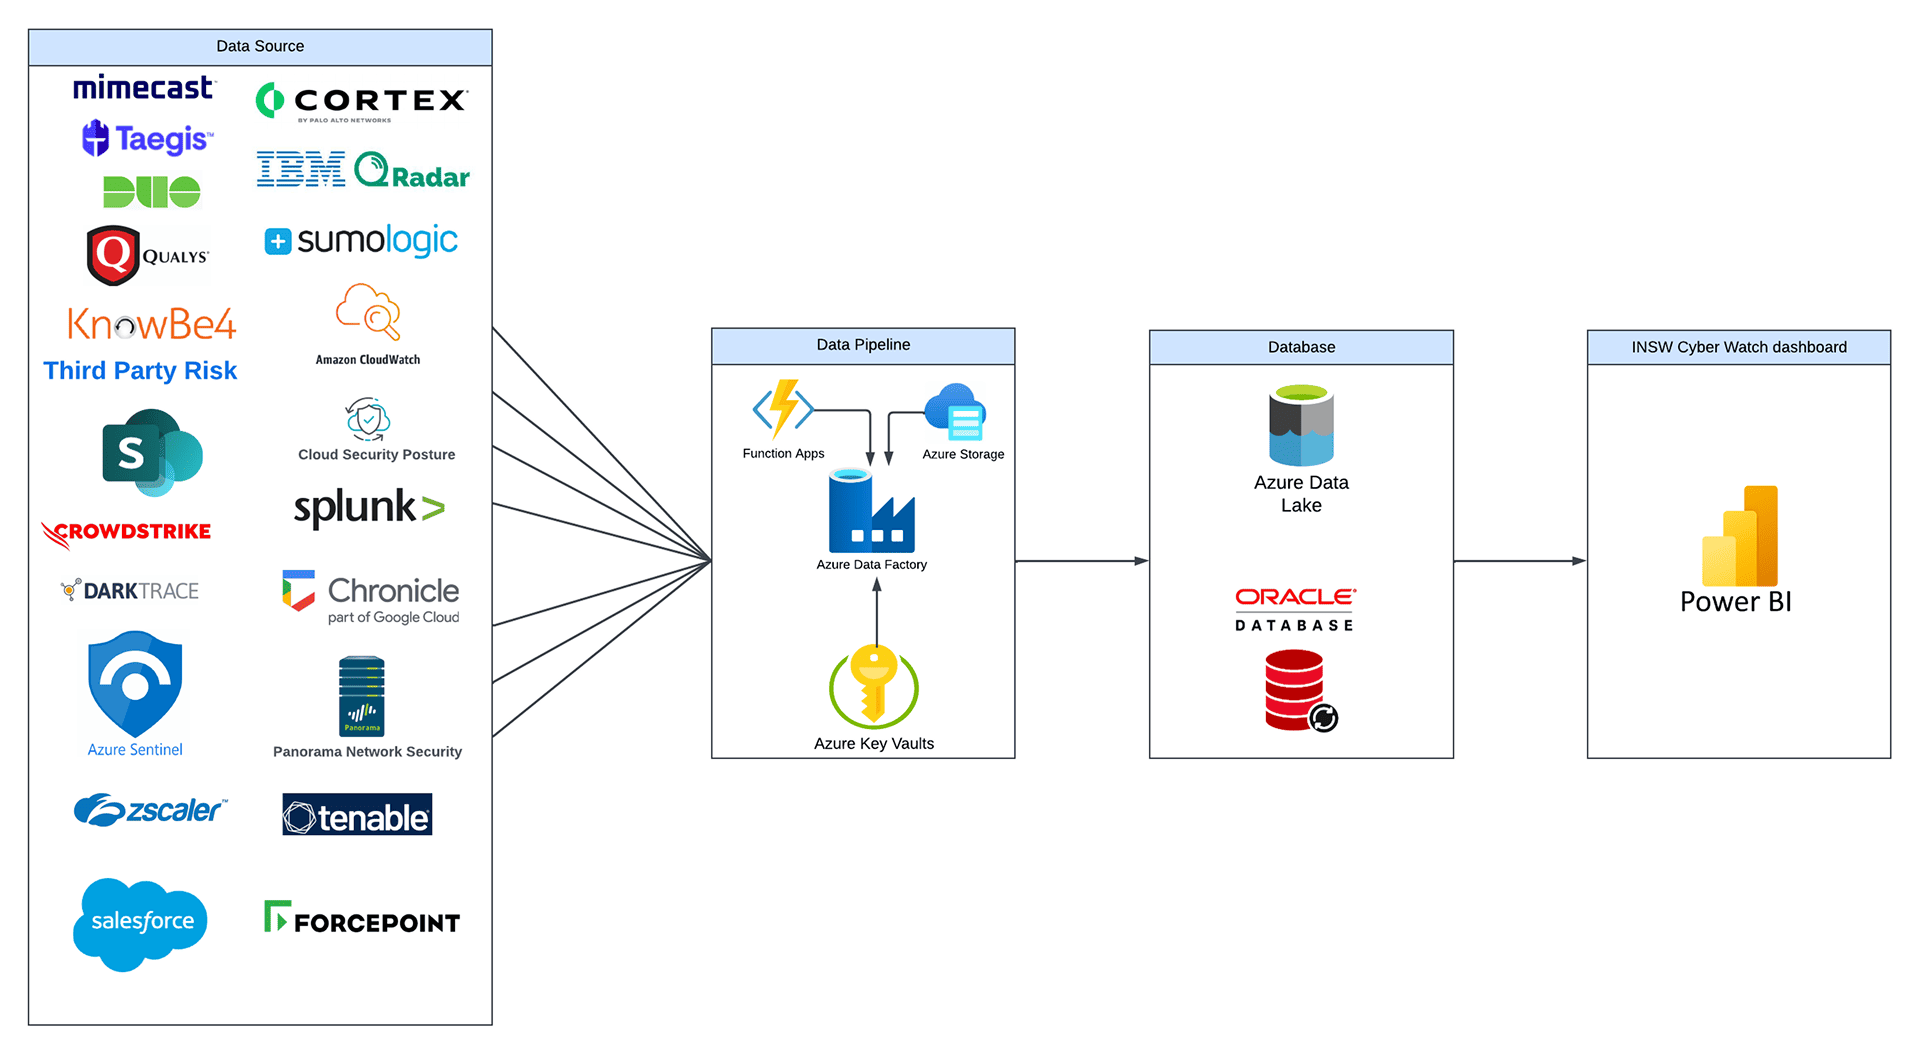
To address the problem, the following data sources were utilized in the final version of the report, rest were eliminated.
Mimecast
Email security platform to protect against phishing and malware attacks.
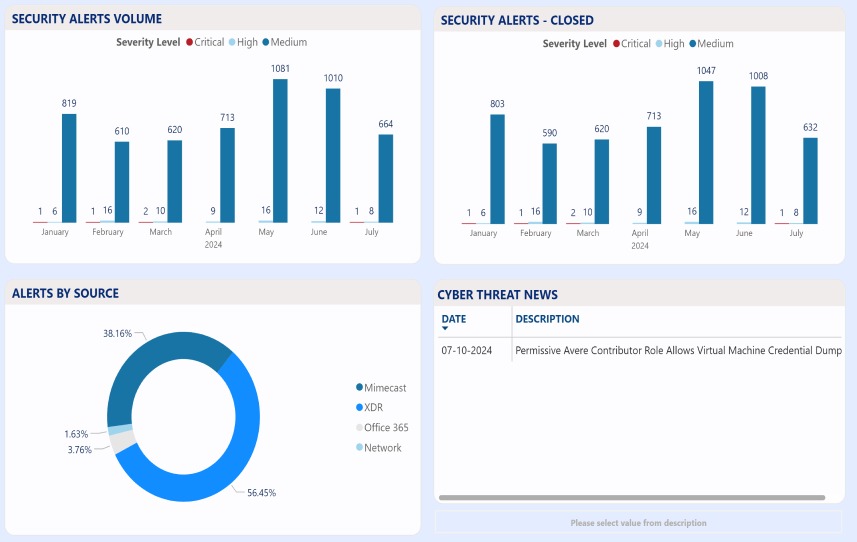
Taegis XDR
Extended Detection and Response platform for threat detection and incident response.
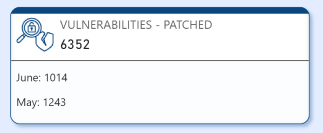
Qualys
Cloud-based security and compliance solutions for vulnerability management.
Duo Admin Portal
Multi-factor authentication and secure access management tool.
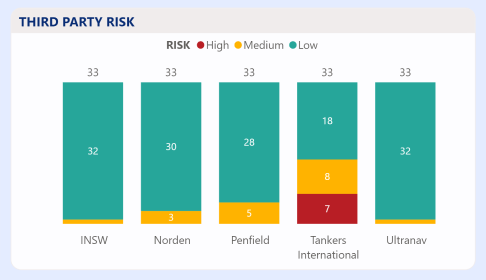
Third Party Risk
Data related to risks associated with third-party vendors and partners.
KnowBe4
Security awareness training and simulated phishing platform.
Backup SharePoint Repository
Security awareness training and simulated phishing platform.
Solution Summary
To create the Cyber Watch Dashboard, the following steps were implemented.
Data Orchestration with ADF
To create the Cyber Watch Dashboard, the following steps were implemented.
Data Aggregation
Utilized REST APIs and SharePoint Repository to fetch data from the selected data sources, ensuring comprehensive coverage of cybersecurity metrics
Data Storage
Leveraged Azure Functions and Azure Key Vault for securely storing and managing sensitive data during the extraction and loading processes into the Oracle database. This allowed for a centralized repository that simplified data management and access.
Data Visualization
Integrated the Oracle database with Power BI to gather and visualize the data. Created an interactive dashboard featuring various types of visualizations, including graphs and cards, to present real-time information and analytics of the security environment.
Presentation Ready
Designed the dashboard with an emphasis on visual appeal and clarity, making it suitable for presentation to board members. The dashboard effectively consolidated key metrics, making it easier for stakeholders to understand the organization’s cybersecurity status at a glance.
Conclusion
The implementation of the Cyber Watch Dashboard has significantly enhanced the International Seaways ability to monitor their cybersecurity environment. By centralizing data from various sources and providing a user-friendly interface, the client can now make informed decisions and respond proactively to security threats. The collaborative efforts of the development team, data engineers, and UI designers resulted in a solution that not only addresses the immediate data challenges but also empowers the INSW’s team to review the historical data with ease.
Cyber Watch Dashboard
Data From Taegis

Data From Qualys

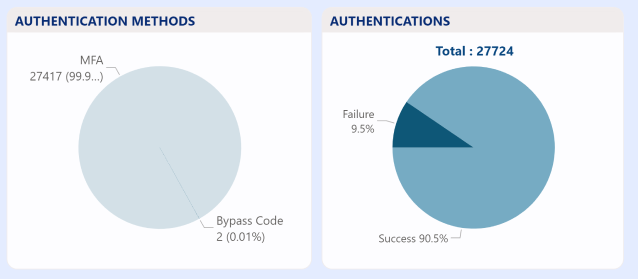
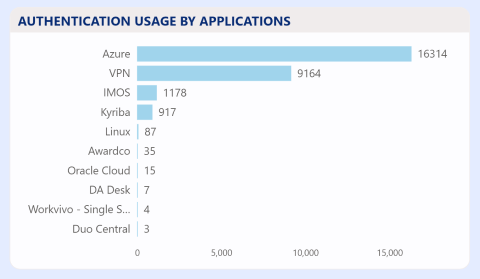
Data From Duo Admin Portal
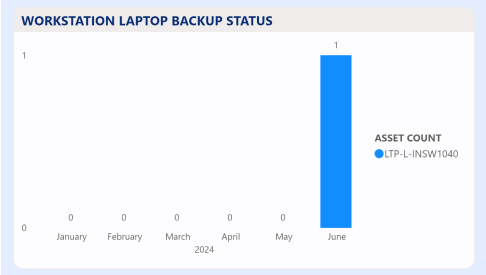
Data From Backup SharePoint Repository

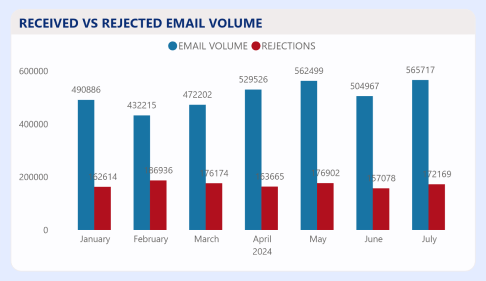
Data From Mimecast
Risk Comparison
