Introduction
So, you’ve annotated your dataset, trained your custom AI model, and it’s finally detecting like a champ on your local machine. But wait—how do you know it’s actually good?
Model validation is a crucial step in any machine learning pipeline. Whether you’re training a YOLOv8 object detector or a text classification model, proper validation ensures your model will perform reliably in the real world.
In this post, we’ll break down how to validate your custom-trained model, covering the most important evaluation metrics, how to interpret them, and how to decide which ones are best for your specific use case.
Why Model Validation Matters
Custom-trained models are often tailored for specific environments—like security cameras, medical imaging, or underwater detection. Without proper validation:
- You might deploy a model that performs poorly in production.
- False positives or negatives can ruin user trust.
- You may miss edge cases or overfit to the training data.
Validation is your safeguard against these problems.
Key Evaluation Metrics for Model Validation
Key Evaluation Metrics for Model Validation are quantitative measures used to assess how well your model performs on unseen data. They help you understand not just how accurate your model is, but how reliable and robust it is across different scenarios. Here are the essential metrics you need to understand:
1. Accuracy
What It Is:
- The percentage of all predictions your model got right.
Formula:
- Accuracy = (TP + TN) / (TP + FP + FN + TN)
When to Use It:
- Best suited for datasets where all classes are well-represented and equally important.
Caution:
- In imbalanced datasets (e.g., fraud detection or rare disease diagnosis), accuracy can be misleading.
Example:
- Imagine a model predicting whether patients have a rare disease that affects only 1 out of 100 people. If it predicts "no disease" for everyone, it will be 99% accurate—but completely useless for catching actual cases.
2. Precision
What It Is:
Out of all the cases your model predicted as positive, how many were truly positive?
Formula:
Precision = TP / (TP + FP)
When to Use It:
When false positives are expensive or dangerous.
Example:
In cancer screening, high precision ensures that when the model flags someone as having cancer, it’s very likely to be true. This reduces unnecessary stress, follow-up tests, and healthcare costs.
Tip:
Use precision when you can’t afford false alarms—e.g., spam filters for VIP clients or approving high-value financial transactions.
3. Recall (a.k.a. Sensitivity)
What It Is:
Out of all the actual positive cases, how many did your model correctly detect?
Formula:
Recall = TP / (TP + FN)
When to Use It:
When missing a true case has serious consequences.
Example:
In disease outbreak detection, missing even one actual case could lead to delayed containment. Here, recall is crucial—you want to catch every possible positive, even if a few false alarms slip in.
Tip:
Use recall when the cost of missing a detection is high—like detecting fraud, security threats, or infectious diseases.
4. F1-Score
What It Is:
A balance between precision and recall. It’s the harmonic mean of the two.
Formula:
F1 = 2 * (Precision * Recall) / (Precision + Recall)
When to Use It:
When you need a balanced approach to minimize both false positives and false negatives.
Example:
In emergency response systems, you need both high recall (to catch all real emergencies) and high precision (to avoid wasting resources on false alarms). F1-score helps evaluate how well your system balances both needs.
Tip:
Use F1 when both types of errors matter—like in automated hiring tools, credit risk scoring, or mental health diagnostics.
Absolutely! Here’s a business-friendly, example-driven, and rephrased version of your remaining metrics (mAP, IoU, Confusion Matrix) with clarity and practical relevance—especially for applications like surveillance, healthcare AI, and industrial automation.
5. Mean Average Precision (mAP)
What It Is:
The average precision calculated across all object classes and various IoU thresholds. It tells you how well your model detects objects—not just that it found them, but that it found them accurately.
Types:
mAP@0.5: Uses a single IoU threshold (0.5). It’s more lenient—just overlap a little, and you get credit.
mAP@0.5:0.95: Averages mAP across multiple thresholds (from 0.5 to 0.95). This is more realistic and challenging.
Example:
In a smart traffic system, detecting vehicles with YOLOv8, mAP tells you how well your system is recognizing cars, bikes, and pedestrians—and whether it’s doing so with good localization.
Use It When:
You’re working with object detection models like YOLO, SSD, or Faster R-CNN and want a holistic view of precision.
6. Intersection over Union (IoU)
What It Is:
A measure of how much your predicted bounding box overlaps with the actual ground truth box.
Formula:
IoU = Area of Overlap / Area of Union
Thresholds:
Common threshold = 0.5. If IoU ≥ 0.5, the detection is considered correct.
Example:
In a warehouse automation system, if a robot misplaces a package by a few inches, IoU measures how closely it matched the intended spot. A low IoU = poor placement accuracy.
Use It When:
You need to validate the spatial accuracy of your bounding boxes—common in surveillance systems, healthcare diagnostics (e.g., tumor detection), and retail analytics (shelf detection, people counting).
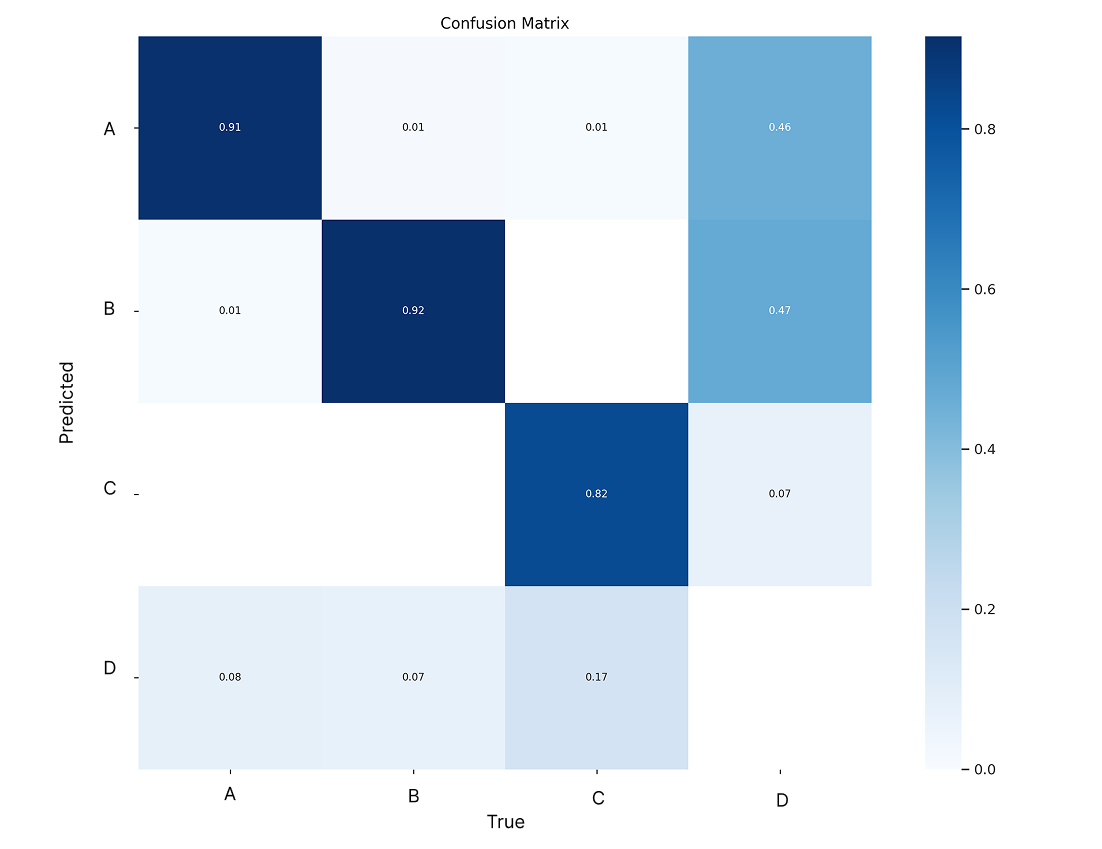
7. Confusion Matrix
What It Is:
A table that shows the counts of:
- True Positives (TP) – Correct positive predictions
- False Positives (FP) – Incorrectly flagged as positive
- False Negatives (FN) – Missed positives
It helps visualize exactly where your model is getting confused.
Example:
In an AI-powered diagnostic tool:
- Class: “Pneumonia”
- If the model says a patient has pneumonia when they don’t (FP), it could lead to unnecessary treatment.
- If it misses a real case (FN), the patient’s condition could worsen.
The confusion matrix reveals which classes your model struggles with, so you can improve performance in those areas.
Use It When:
You want a granular breakdown of classification results—especially useful in multiclass classification problems or model debugging.
How to Choose the Right Metric
| Use Case | Recommended Metrics |
|---|---|
| Binary classification | Precision, Recall, F1-score |
| Imbalanced classes | F1-score, Recall |
| Object detection (YOLO) | mAP@0.5, mAP@0.5:0.95, IoU |
| Real-time alerts (e.g., safety) | High Recall, Confusion Matrix |
| Multi-class classification | Macro/micro averaged Precision & Recall |
Best Practices for Model Validation
1. Always validate on a separate test set.
Don’t reuse training data.
2. Use cross-validation for small datasets.
Ensures robustness.
3. Track metrics over time.
Helps detect model drift or regression.
4. Visualize predictions.
Especially for object detection—overlay boxes and review false positives/negatives.
5. Set realistic thresholds.
Especially for IoU, F1, and confidence scores.
Confusion Matrix for Custom Object Detection
Confusion matrix showing true positives, false positives, and false negatives for model evaluation
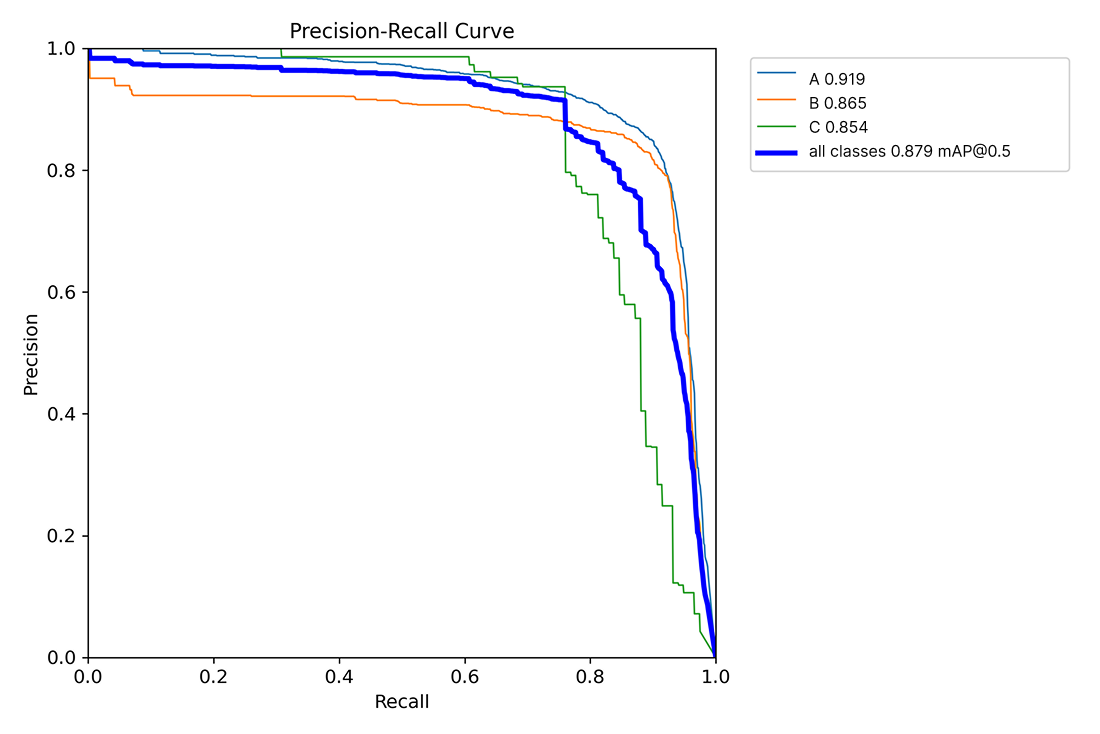
Precision-Recall Curve
Chart comparing precision, recall, and accuracy in a machine learning model
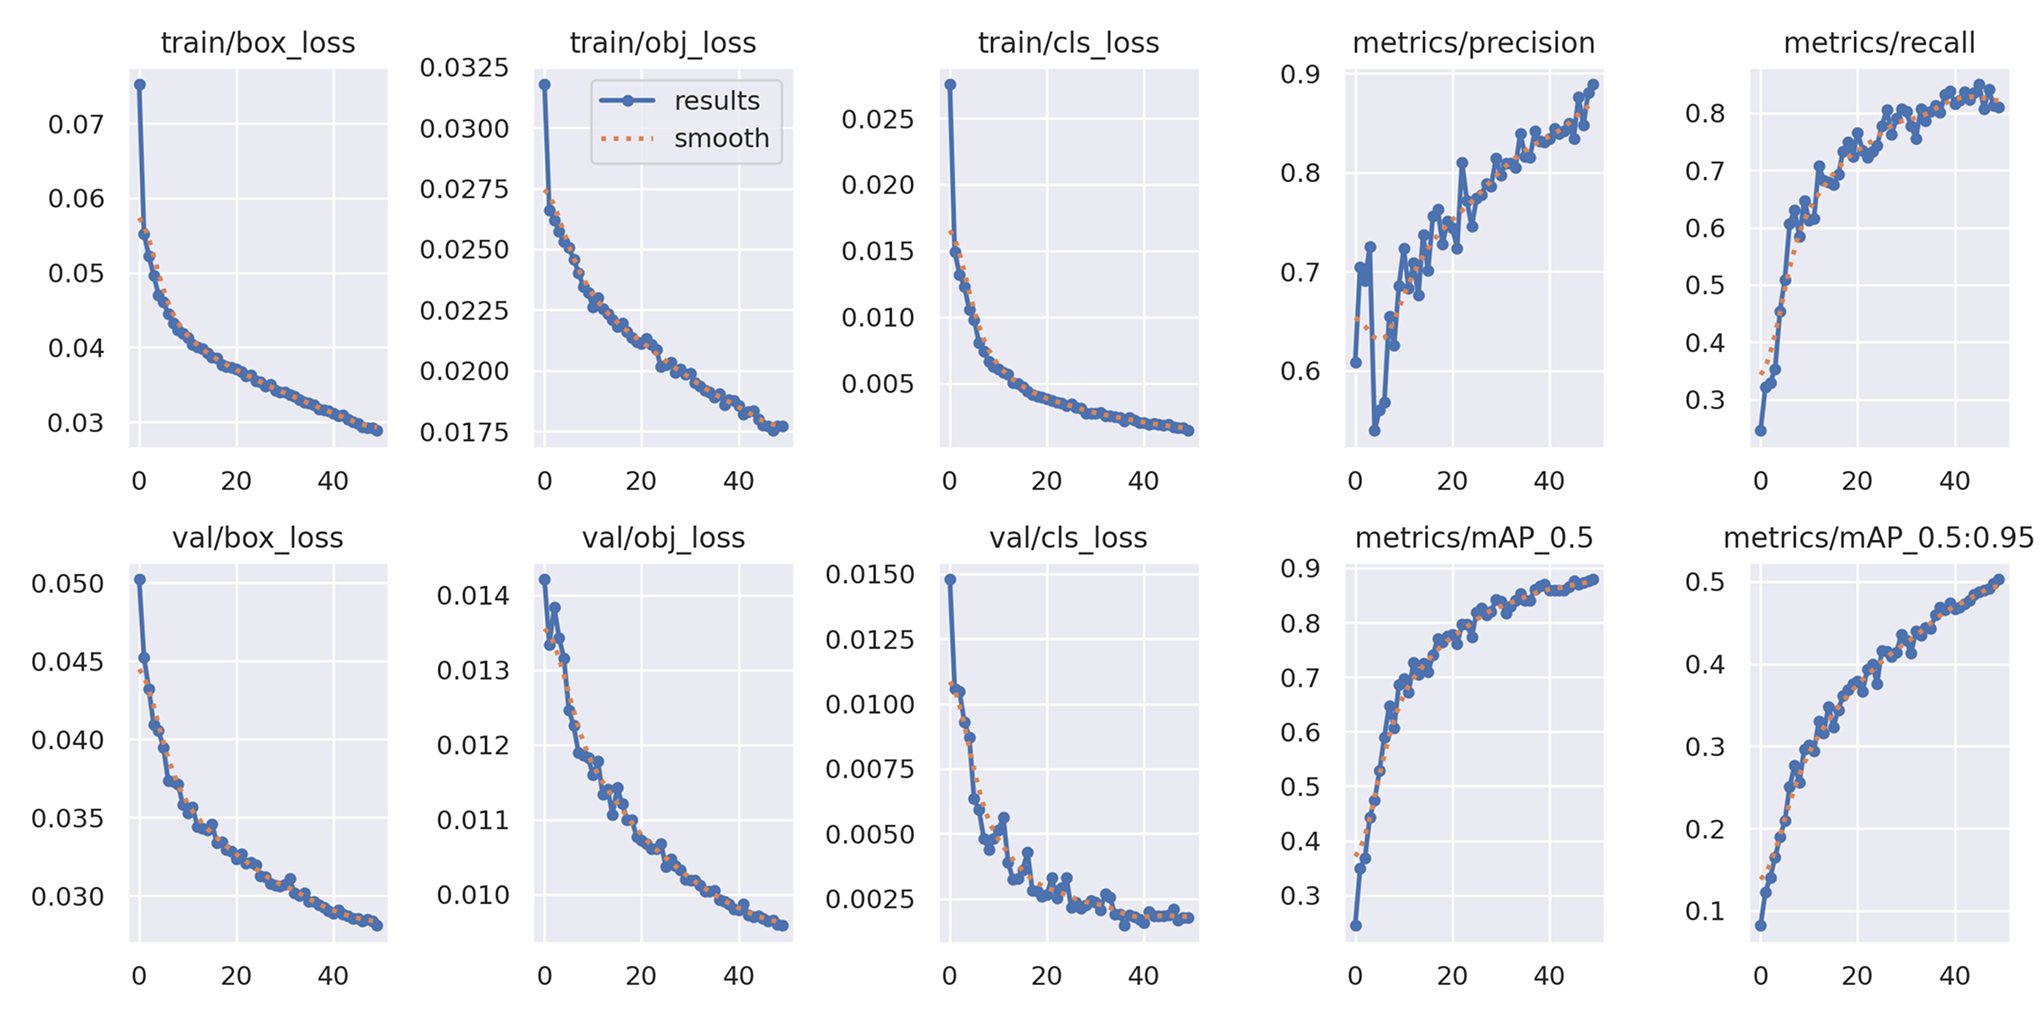
mAP Curve for YOLO Model
Mean Average Precision (mAP) curve illustrating object detection model performance
Conclusion
Validating your custom-trained AI model is not just a checkbox—it’s how you ensure that your model performs reliably and ethically. By using the right metrics and evaluation methods, you’ll build confidence in your model’s real-world deployment.
Stay tuned for the next post in our series where we’ll explore model optimization and deployment!